
Introduction
We spend so much time taking care what food we consume and how it affects our health but rarely do we stop to think about the very air that we breath. Depending on our location anything from a simple walk to just sitting at our desk could be exposing us to many more unhealthy substances than we could have imagined. Some cities now report on smog as part of their daily weather reports and this trend is only becoming more prevalent as pollution becomes a bigger and better understood problem. Air quality both indoors and out is starting to become a more conscious issue that is becoming as important as knowing the day's weather.
While the number of air quality advisories may be on a downward trend in some areas, that does not mean the actual number of smog days has decreased. Looking at official data from Ontario shows almost consistently the number of advisories is less than actual smog days.
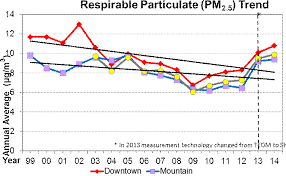
PM2.5 Trend for different locations
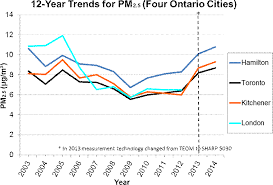
Another report from the Toronto Star shows that looking at large areas may not and often does not show the full picture. This is all from a province that has prided itself on its climate change and pollutants stance. Data from the US shows similar trends.
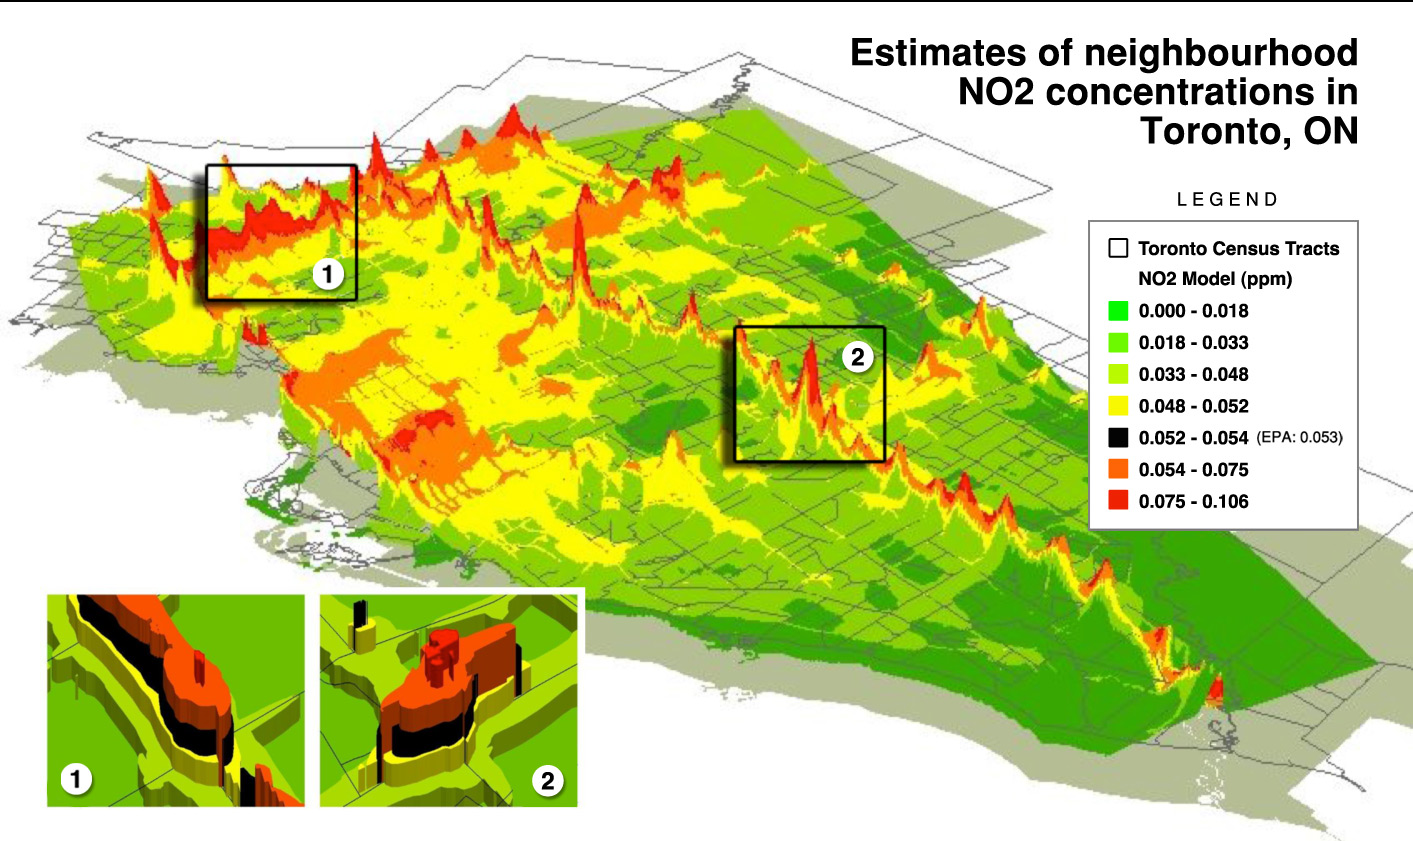
Air quality variations across Toronto
The AirVisual air quality monitor is a product from an international team that is looking to help the public be more aware of the air quality in both their immediate and general environment. By producing a product that measures particles that fit in with the respiratory ingestible size and below, they are hoping to promote change through public awareness.
Air Quality Effect on Daily Life
Air quality affects us more than we realize and often more frequently than we would like to admit. From larger particles in perfumes to smaller particles in smog they all have their effects.
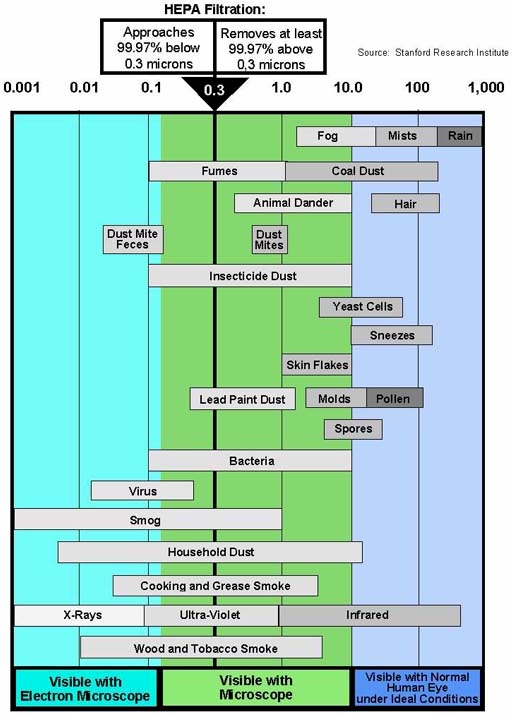
Common particles found in the Air
Indoor Air Quality
Populations that live further from the equator may spend a much as 90% of their time indoors. Staying indoors this much of the time, whether working in an office with a HVAC system or in our homes, we may believe we are immune from the pollutants and negative effects of bad air quality but this is not so.
The number and diversity of air pollutants is vast, even in indoor environments. According to the Canadian Centre for Occupational Health and Safety the list includes anything from gasses (CO2, VOCs, etc.) to various size particles (tobacco smoke, dust, fiberglass, etc). The specific effects of exposure to these gasses and particles can range from the common dry and irritated eyes and throat through to shortness of breath, dizziness and even nausea. These symptoms may not always point to one specific source or even to one form of sickness, the overall issue has been given various names such as Sick Building Syndrome (SBS) or Tight Building Syndrome (TBS), Building-Related Illness (BRI) and Multiple Chemical Sensitivities (MCS). Whatever it may be called the effects are very real and can have negative effects not just on health but on productivity as well a company's bottom line.
Outdoor Air Quality
While most people may think they understand and know what populations are in the air outside the reality is most of us don’t. For those of us that think we do, we may not fully understand implications of such air quality is.
We all understand that cars emit fumes and produce smog that is unhealthy, but what is smog and why is it so, we often do not know. Smog contains gases and fine particles. The gasses include such compounds as ozone (O3), Nitrogen Oxides (NOx), VOCs among others. The particles may be made up from anything including smoke, dust, even fine vapour particles.
The effects of this soup of chemicals and particles is varied but always negative. The most common effects of smog is eye and throat irritation but may include shortness of breath, asthma and even Chronic Obstructive Pulmonary Disease (COPD).
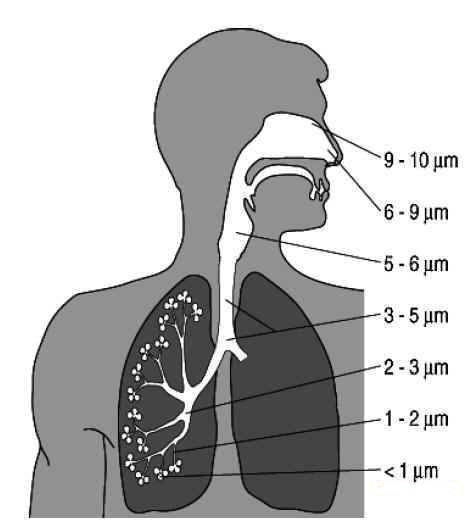
Correlation between particle size and respiratory penetration
AirVisual Node
For these reasons air quality is becoming more important and more relevant in our daily lives. And to help us better understand what air quality is the AirVisual Node provides real time data as well as forecasts to help plan when activities should be done and how air quality can be improved. The AirVisual Node uses AI to forecast future air quality based on past air quality samples. If the AirVisual Node is used outdoors then the software uses both weather data as well as data from more than 8000 environmental sampling stations around the world to give a three day forecast of air quality in your area.
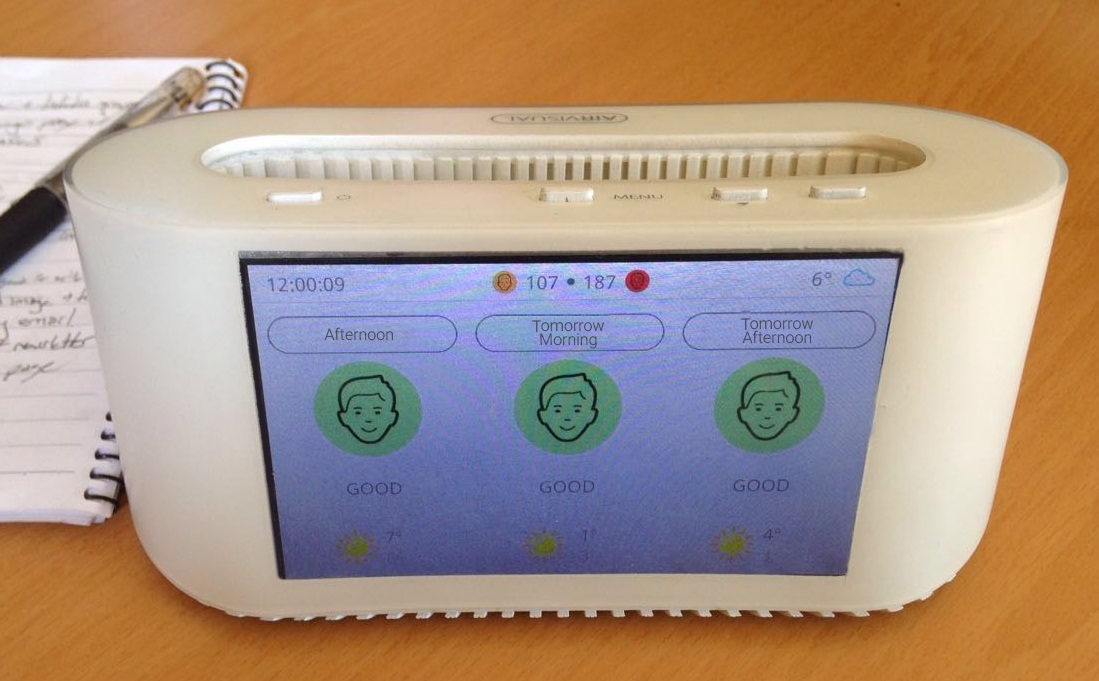
AirVisual three day forecast
Besides the AI built into the the AirVisual software, to help forecast air quality, the real breakthrough with the AirVisual Node is the quality of the PM2.5 sensor compared to its price point. This is just one of four sensors built into the AirVisual Node and the team is hoping at some point to be able to add more to help predict other components of smog.
Sensors
With the sensitivity and accuracy of the AirVisual Node there is a constant need for the unit to take into account the various factors that may throw of its readings. To ensure the unit stays as accurate as possible there are two calibrating sensors to help remove these known offsets.
2.5µm Laser Sensor
The AirVisual Node uses a laser sensor to count particles in the 2.5 μm range. The sensor has undergone a decent amount of testing and more than a year worth of R&D. The constant testing has proven that the the AirVisual Node has a very close correlation with expensive Beta Attenuation Monitors and well within the acceptable region.
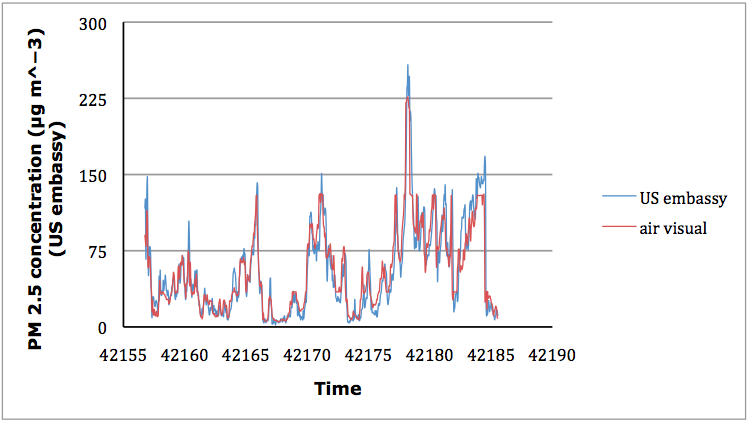
Correlation between AirVisual Node and a Beta Attenuation Monitor
CO2 Sensor
As CO2 plays a part in describing the amount of ventilation or usable air is around us, the AirVisual Node has a CO2 sensor that measures between 400 ppm and 10,000 ppm. While the exact type and accuracy of the sensor has not been disclosed, it has been stated that the sensor is self calibrating and should remain accurate for at least 7 years.
Temperature
The temperature sensor is rated to work between -10°C ~ 40°C which would allow the unit to easily work indoors and outdoors in most places around the world with little trouble. For those in the more northern regions (Canada, Greenland, Sweden, Finland, Norway, Russia, etc) they may be times of the year that the unit may not work acceptably as an outdoor sensor.
Humidity
The humidity sensor has a range between 0 ~ 100% RH. This is standard for most sensors today and would allow for the AirVisual Node to be used in most if not all habitable environments. These last two sensors while giving relevant and real time data are important mainly due to their ability to help the laser sensor self calibrate in various environmental conditions.
Setup and Usage
The AirVisual Node is simple and easy to setup, once plugged in a setup wizard walks the user through connecting to the local WiFi network. Once this has been completed the AirVisual Node does the rest. Since the unit can be identified as an outdoor node the location is needed. If this mode is selected then the AirVisual Node uses the IP address to obtain its location removing any further setup from the user. If selected as in indoor node then no further setup is required.
The daily usage of the AirVisual Node is just as simple. With a 5 inch LED screen that is easy to read and understand the need for an app or PC to read the data is removed. That being said should you want to check your stats from a remote location this can be done from a free app on either you Android or iOS device.
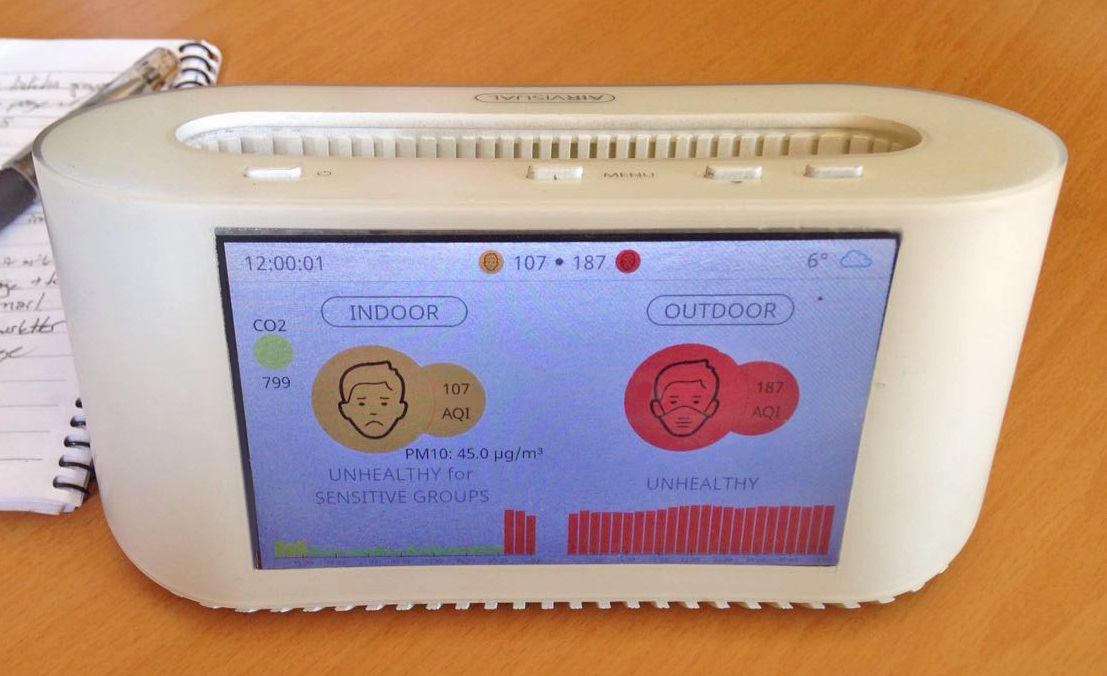
AirVisual Node display
The AirVisual Node can also be used to test different areas around your environment as well as to determine if the measures you have taken to rectify your air quality are working. With a built in battery that should last approximately 5 hours, taking measurements around a home or office would be an easy task. In addition to this, the CO2 sensor has an update rate of 1 - 2 minutes and the PM2.5 becomes stable within 30 seconds. All these factors together allow the AirVisual Node to be used to evaluate your indoor space as well how corrective measures you have taken are working.
If the unit is connected to the outdoor network, then the unit pulls data from the AirVisual cloud data to give a three day forecast on air quality. This prediction uses over 80,000 data points from around the world. The air quality (AQI) readings are provided using the EPA standards making the readings easy to understand and consistent. While AirVisual has a map of world air pollution and has a lot of sites there does appear to be some simplification or missing sites from the map while others are added. In order to fill the missing air quality information in the world, AirVisual has already deployed some Nodes in countries that do not report air pollution information. Phnom Penh, Cambodia, got its first air pollution monitoring data from an AirVisual Node placed in the vicinity of the Olympic stadium.
Viability of project
While this may seem to be a very optimistic project, the expertise gathered by the team is both vast and impressive. With a number of working units in the field already the big question often is getting a product to market. After two years of R&D including how best to make the unit is such away that it is easy to manufacture the team is close to the finish line. One of their biggest assets at this point in the project is the experience and expertise in manufacturing the team has. With at least one member having 8 years experience in manufacturing the ability of the team to cross the finish line is greatly increased.
good
ReplyDeleteThank you for sharing this amazing information. Keep sharing like this blog
ReplyDeleteIndoor Air Quality Monitor